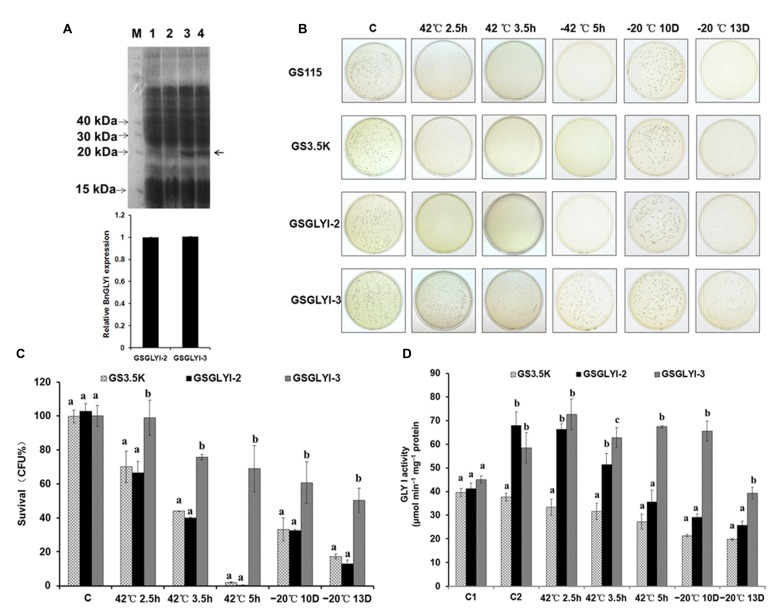
FIGURE 4.
Analysis of BnGLYI expression in Pichia pastoris. (A) SDS-PAGE analysis of P. pastoris proteins. M: protein marker (KDa); 1: GS115; 2: GS3.5K; 3: GSGLYI-2; 4: GSGLYI-3. The relative BnGLYI expression levels were calculated after normalization to the total protein content. The expression levels of GSGLYI-2 were normalized to 1.0, and the data were analyzed using ImageJ software. The bars represent the means (three replicates) ± SD. (B) Growth of P. pastoris cells stressed at 42°C for 2.5, 3.5, and 5 h or stressed at –20°C for 10 D and 13 D. Diluted culture samples were treated at 42°C in a water bath and were then plated on YPD plates that were incubated at 30°C. (C) Viability of P. pastoris transformants carrying pPIC3.5K-BnGLYI-2 (GSGLYI-2), pPIC3.5K-BnGLYI-3 (GSGLYI-3), or pPIC3.5K (GS3.5K) that were stressed as described in (B). Cell viability is plotted as the percentage of CFUs relative to the number of CFUs in their respective controls. The data are presented as the means ± SD of three independent assays; different letters indicate significant differences (P < 0.05) under each stress condition, and values followed by the same letter are not significantly different according to Tukey’s test. (D) GLYI activity in crude soluble protein extracted from P. pastoris transformed with pPIC3.5K (GS3.5K), pPIC3.5K-BnGLYI-2 (GSGLYI-2), or pPIC3.5K-BnGLYI-3 (GSGLYI-3) under different temperature stress conditions. C, control; C1, non-induced cells cultured under the control conditions; C2, induced cells cultured under the control conditions.

