Fig. 5.
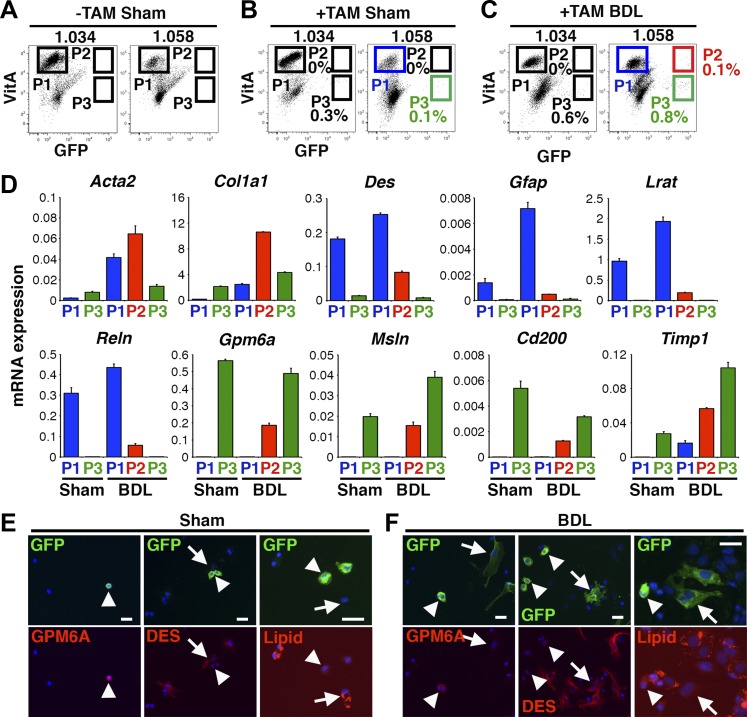
FACS analysis of autofluorescence of VitA in HSCs and MC-derived HSCs in biliary fibrosis. Wt1CreERT2/+;R26TGfl/fl mice were treated with or without tamoxifen and were subjected to sham operation or BDL. A–C: FACS analysis of the 1.034 and 1.058 fractions prepared from sham or BDL models. Cells were analyzed based on the autofluorescence of VitA and GFP. GFP− VitA+, GFP+ VitA+, and GFP+ VitA− cells are gated as P1, P2, and P3, respectively. D: QPCR of 1.058-P1, -P2, and -P3 from the sham (B) and BDL (C) groups. P1 HSCs increase activation markers by BDL. P2 MC-derived HSCs express both HSC and MC markers. P3 MCs express MC markers. E and F: cultured 1.058 fractions prepared from the sham (B) or BDL (C) were stained with a lipid-specific fluorescent dye (red) and antibodies against GFP (green), GPM6A (red), or DES (red). E: arrowheads and arrows indicate GFP+ MCs and GFP− HSCs, respectively. F: arrowheads and arrows indicate GFP+ MCs and GFP+ MC-derived HSCs, respectively. Nuclei were counterstained with DAPI. Bar: 20 μm.

