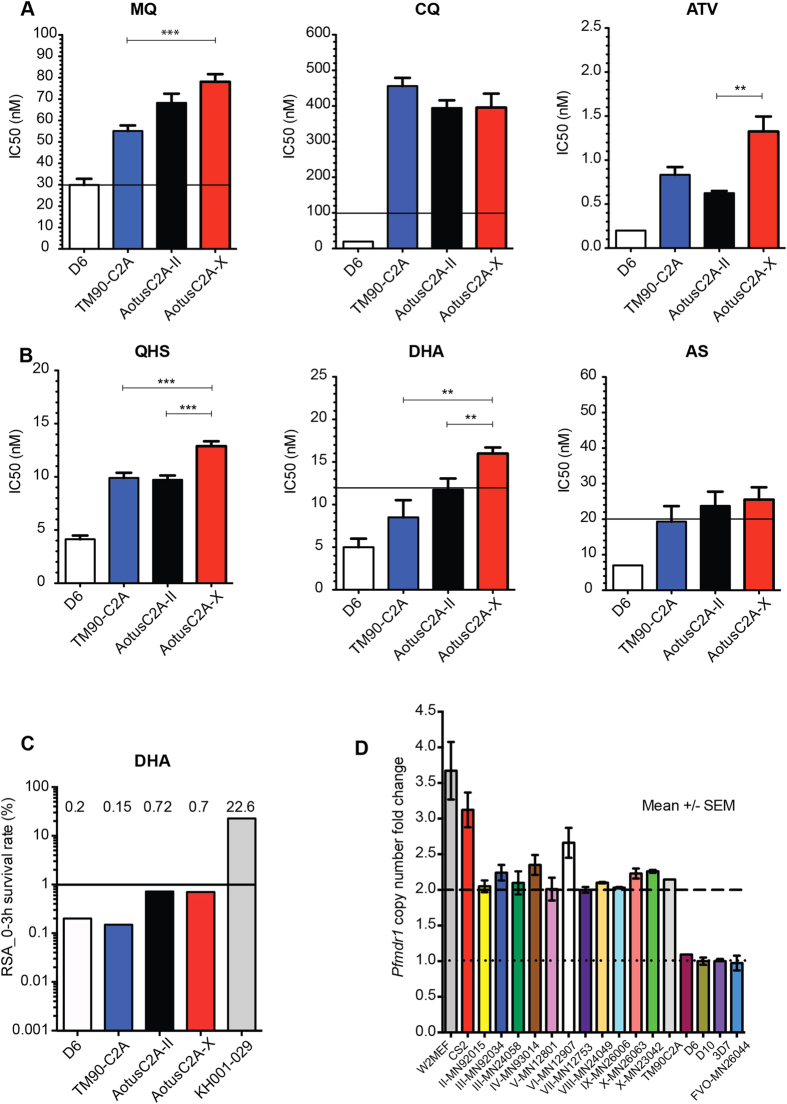
Figure 2. Ex vivo/in vitro antimalarial drug susceptibility and Pfmdr1 copy number variation of PfC2A across Aotus passages.
(A,B) IC50 antimalarial drug nM concentration bar plots of reference strains D6 (white bar), in vitro culture adapted TM90C2A (blue bar) and pfC2A Aotus adapted passage levels II (black bar) and X (red bar). Drug IC50 nM resistance threshold (black line). Mean ± sample SEM (see also Table S1). (C) DHA drug susceptibility based on RSA. Survival percentage = DHA treated parasites/DMSO treated parasites × 100. Red bar represents survival of artemisinin resistant positive control strain KH001-029, D6 is included as negative reference strain. Significant survival threshold (black line) is set at 1% as in Witkowski et al.24. (D) Passage level pfmdr1 copy number fold change of a Plasmodium falciparum C2A clone during adaption to Aotus monkeys. P. falciparum strains with two pfmdr1 gene copies are considered resistant to MQ. Mean ± sample SEM. Dashed line indicates threshold for pfmdr1 CN level indicative of MQ resistance. Dotted line indicates threshold for pfmdr1 CN level indicative of MQ sensitivity. MQ = Mefloquine; CQ = Chloroquine; ATV = Atovaquone; AS = Artesunate; QHS = Artemisinin; DHA = Dihydroartemisinin. p = Mann-Whitney U significance t test unpaired samples. ***p < 0.005; **p < 0.05.

