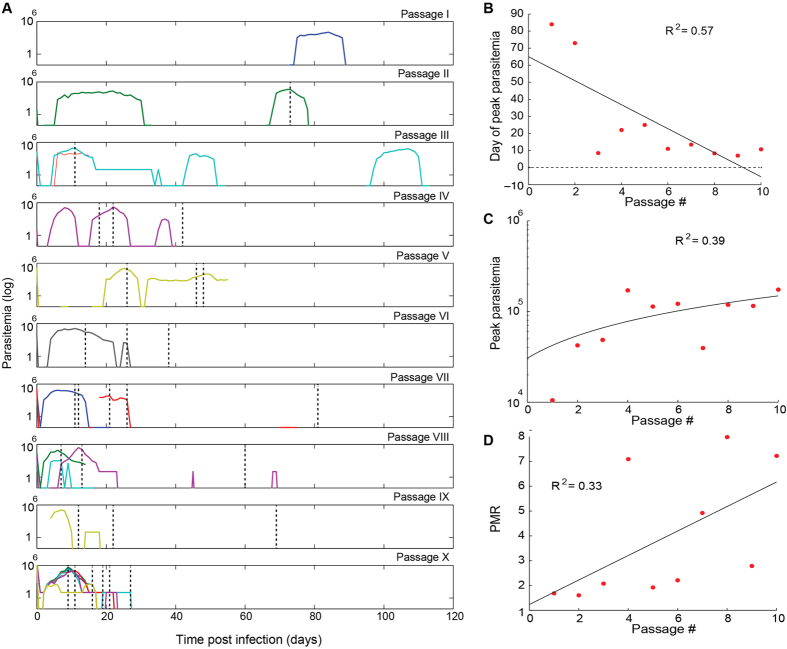
Figure 4. Plasmodium falciparum C2A growth across Aotus passages.
(A) Parasitemia plots from individual monkeys (colored lines) with time of treatment (black dotted lines) across each passage. Parasitemia was followed for up to 100 days post inoculation and frequently fell below detectability (disappearance of colored lines). (B) Day of peak parasitemia trend. The day of peak parasitemia is the time since inoculation when peak parasitemia was achieved, averaged across monkeys for each passage. (C) Peak parasitemia trend. The value of peak parasitemia is the maximum parasitemia reached over the course of infection, averaged across monkeys for each passage. (D) Parasite multiplication rate (PMR). The PMR is the median of parasitemia increases across 48-hr periods over the course of an infection, averaged across monkeys for each passage. The data is modeled with linear regression.

