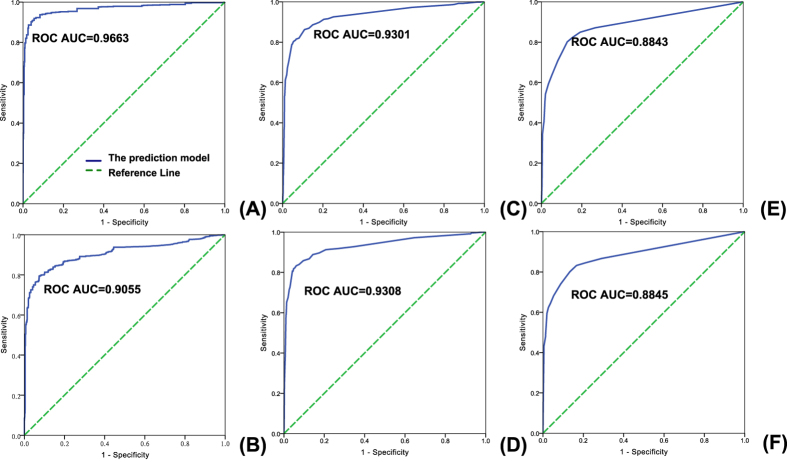
Figure 1. ROC curves and their corresponding AUCs of the target prediction model based on cross-validation and the independent test set.
(A,B) ROC curves and their AUCs based on the golden standard dataset using leave-one-interaction-out cross-validation (A) and leave-one-drug-out cross-validation (B). (C) ROC curve and its AUC based on the independent test set which is independent of the golden standard dataset on drug-target interaction. (D) ROC curve and its AUC based on “the independent test set-drug” which is independent of the golden standard dataset on drug (see Materials and Methods). (E,F) ROC curves and their AUCs of the prediction model only integrating chemical structure-involved features based on the independent test set (E) and “the independent test set-drug” (F).

