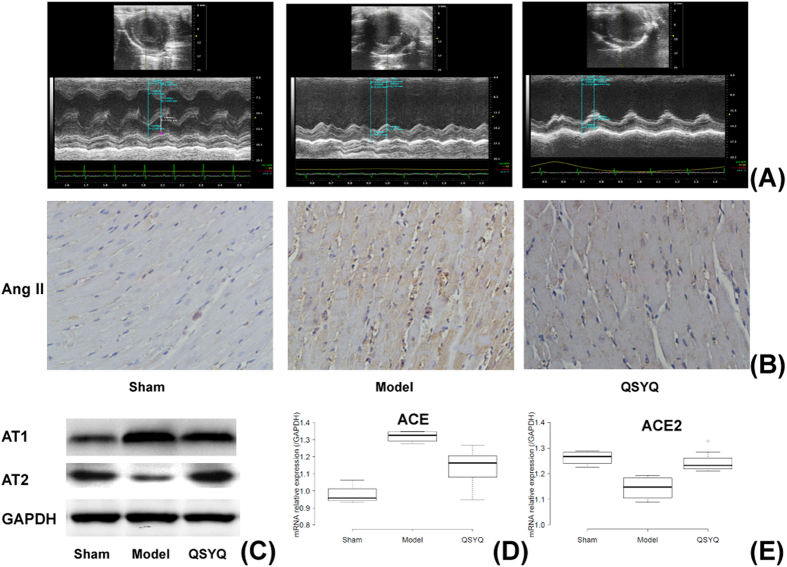
Figure 5. Experimental validation of the RAAS pathway targeted by QSYQ based on HF model of SD rats.
(A) Echocardiography results reflecting apparent different cardiac functions (described by EF) and ventricular wall movement (described by LVEDs and LVEDd) of rats in different groups. (B) IHC results of Ang II in myocardial tissues of rats in different groups. (C) The expression levels of AT1 and AT2 in different groups based on western blot. (D,E) The expression levels of ACE and ACE2 in different groups based on PCR. The boxplots were draw by BoxPlotR56.

