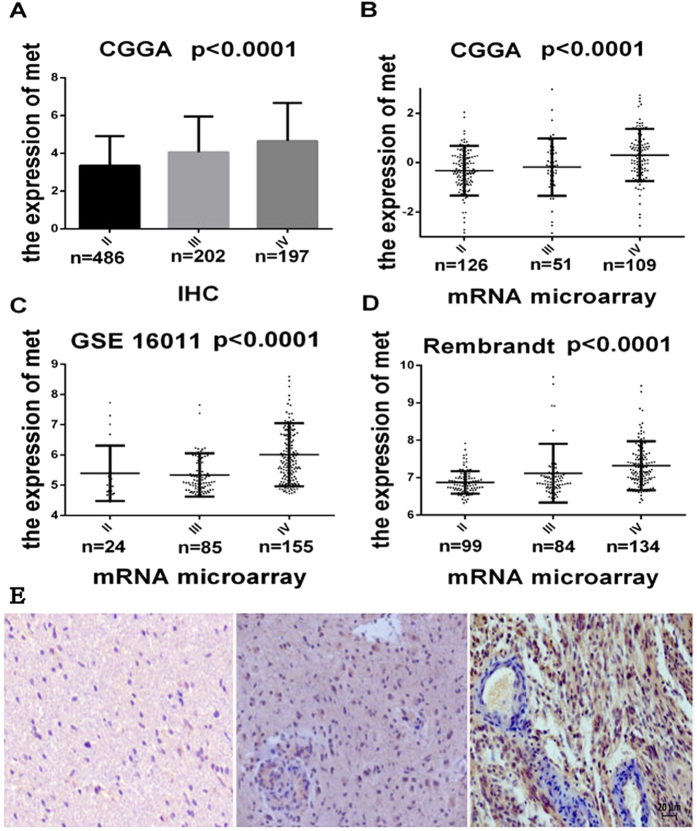
Figure 1. c-MET differences in all grades and all three databases.
(A) The protein expression patterns of c-Met in the CGGA IHC validation cohort, which contained 887 glioma tissues. (B, C, D) c-Met expression patterns in the microarray validation cohorts, which contained 286 (CGGA), 317 (REMBRANDT) and 264 (GSE16011) glioma tissues. Single spots indicate the gene expression values of individual patients. The lines in the middle indicate the mean expression values. (E) Representative antibody staining for c-Met (Grade II-left, Grade III-middle, and pGBM-right) showing that c-Met expression increased gradually with increasing tumor grade. All slides stained for c-Met were individually reviewed at 200x magnification. Scalebar 20 μm. ANOVA was to examine the overall P values.

