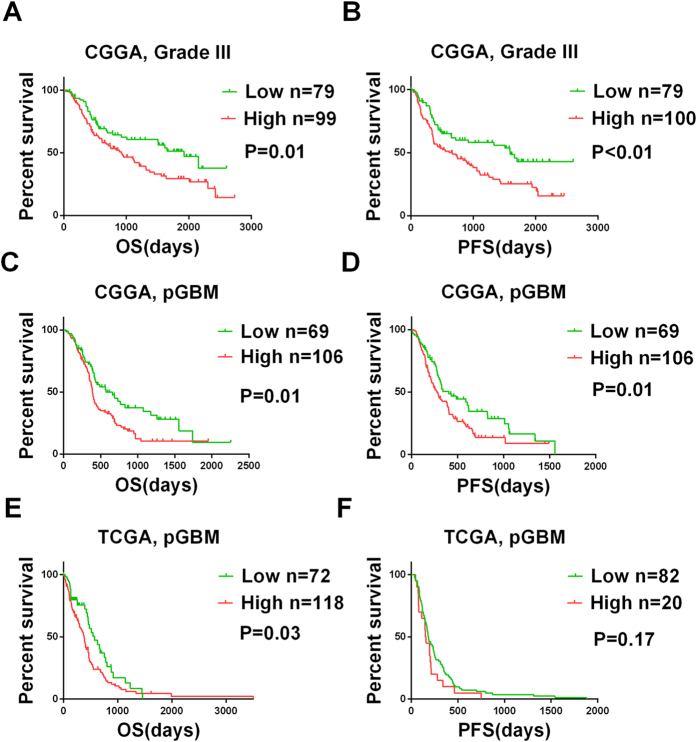
Figure 2. The prognostic value of the c-Met protein in the CGGA and validation datasets.
Kaplan-Meier curves for the two high-grade glioma databases that were constructed according to the protein expression of c-Met. In the CGGA datasets, overall survival (A) and progression-free survival (B) show that grade III patients carrying negative c-Met protein expression survived significantly longer. Overall survival (C) and progression-free survival (D) show that pGBM patients carrying negative c-Met protein expression survived significantly longer. In the TCGA datasets, overall survival (E) and progression-free survival (F) show that pGBM patients carrying negative c-Met protein expression survived longer. The CGGA values were acquired via IHC, and the TCGA values were downloaded from the TCGA web site. The log-rank test was used to calculate the P values.

