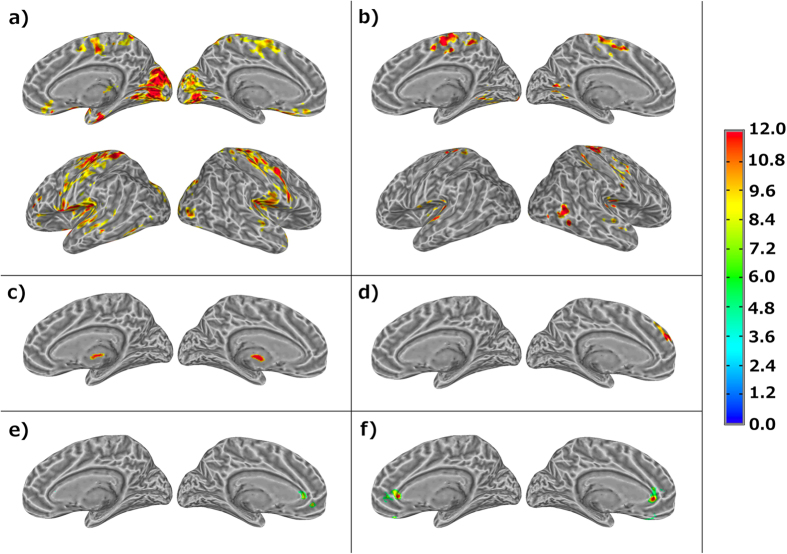
Figure 2. Summary of F-score results from the 3-way ANOVA analysis of CCI and CSI data to depict the brain regions of statistically significant differences (p ≤ 0.05) in functional connectivity associated with the 2 fixed factors (the PVT and subject group) and their interaction.
(a) The brain regions with statistical significant change in CCI before and after PVT for all participants; (b) The brain regions with statistically significant change in CSI before and after PVT for all participants; (c) The brain regions with statistically significant CCI difference between mTBI patients and healthy controls; (d) The brain regions with statistically significant CSI difference between mTBI patients and healthy controls; (e) The brain regions with statistically significant interaction effect of two main factors on CCI. That is the brain areas where CCI of the mTBI patients and healthy controls are affected differently by the PVT performance; (f) The brain regions with statistically significant interaction effect of two main factors on CSI. That is the brain areas where CSI of the mTBI patients and controls are affected differently by the PVT performance.

