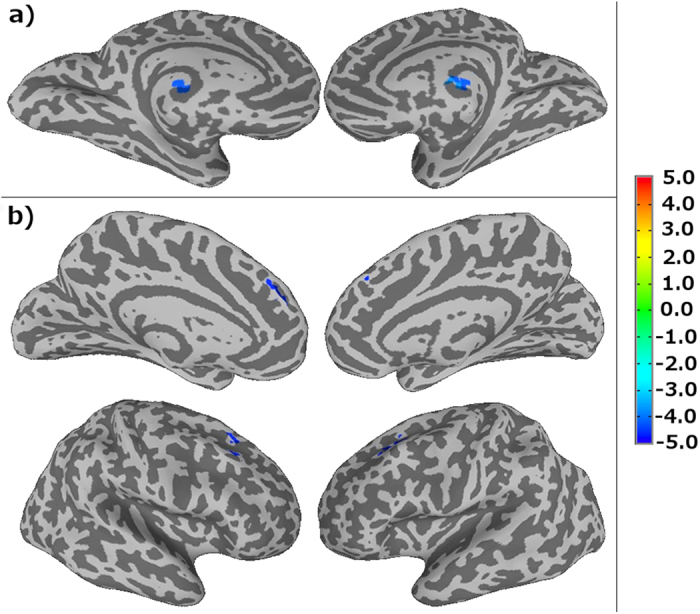
Figure 3. Results obtained from the linear regression analysis of functional connectivity as a function of the self-reported fatigue.

(a) Brain regions with significant (p ≤ 0.05) correlation between CCI and VAS-f. (b) Brain regions with significant (p ≤ 0.05) correlation between CSI and VAS-f.
