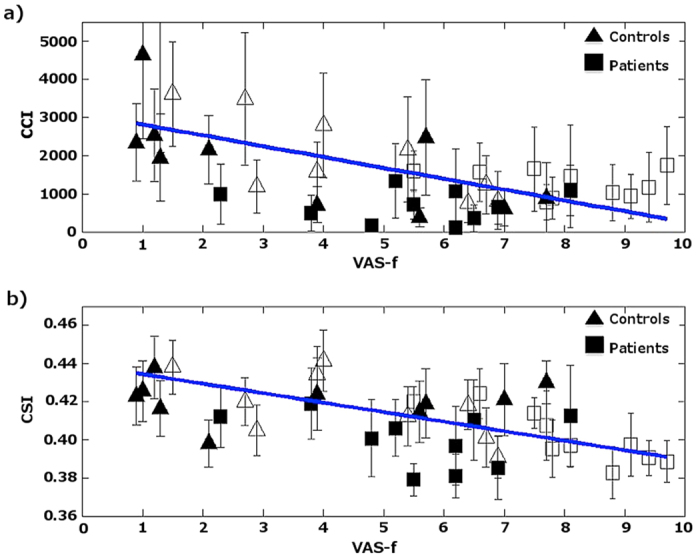
Figure 4. Scattered plot of the ROI averages of functional connectivity for the brain regions that have significant (p < 0.05) linear correlation with self-reported fatigue.

(a) ROI averages of CCI as a function of VAS-f for all participants. (b) ROI averages of CSI as a function of VAS-f for all participants. The error bars denote the standard deviation of the different voxels within the detected ROI. The filled and blank symbols represent the measurements before and after the PVTs, respectively.
