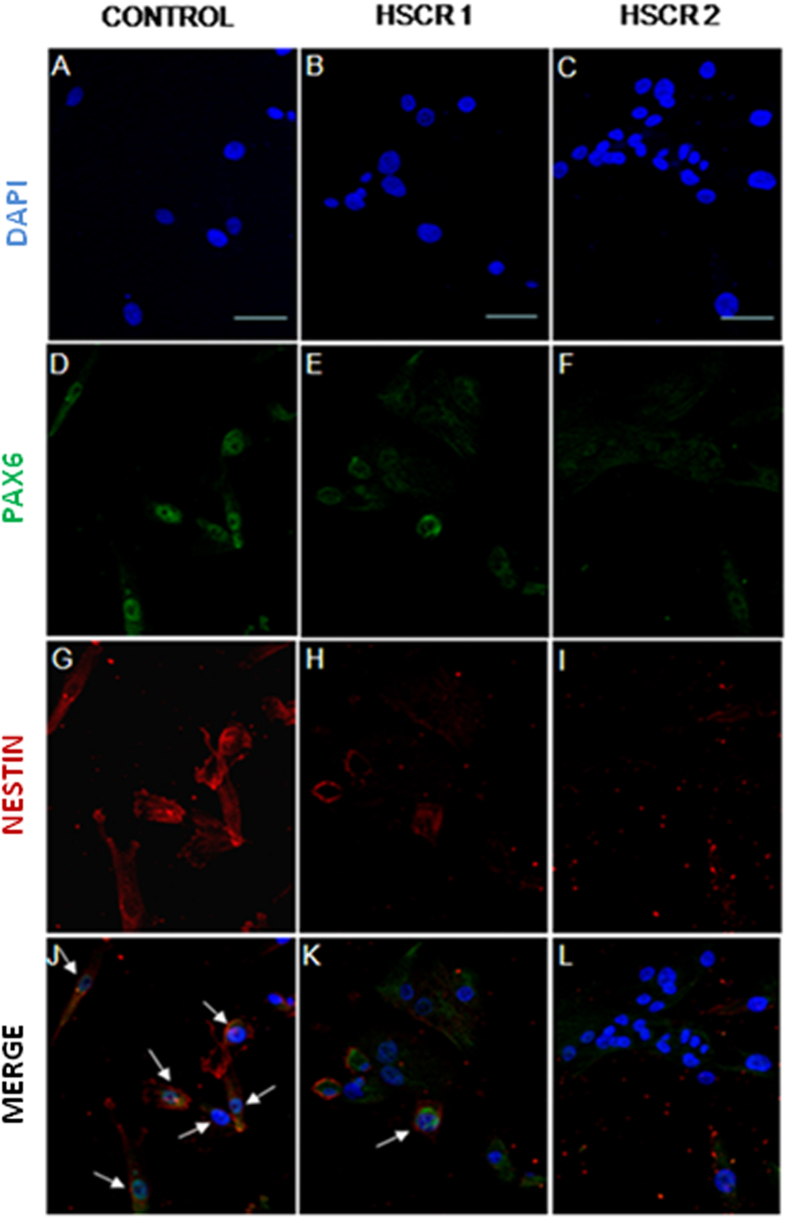
Figure 1. Expression of PAX6 in HSCR-NBLs compared with control-NLBs.
Confocal images of protein expression of PAX6 in neural precursors derived from controls (A,D,G,J) and HSCR patients (B,C,E,F,H,I,K,L). Immunostaining for PAX6 is shown in green and for NESTIN is shown in red. Cell nuclei were counterstained with 4´,6-diamidino-2-phenylindole (blue). Scale bars = 25 μM.

