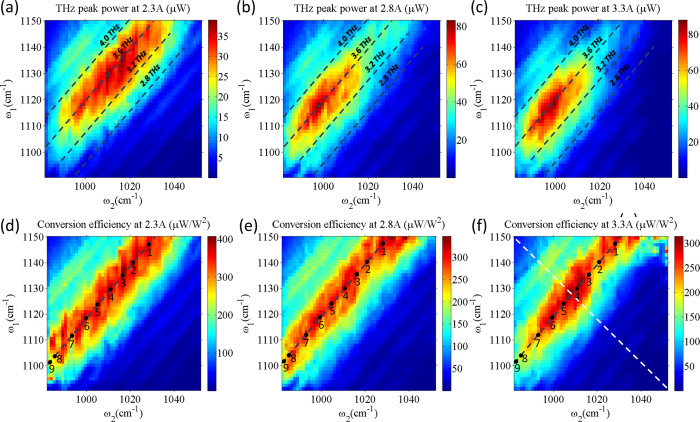
Figure 4. THz DFG performance of the device.
Panels (a–c) show the THz peak power output (in μW) of the device at pump currents of 2.3 A, 2.8 A and 3.3 A, respectively, as a function of mid-IR pump frequencies ω1 and ω2. Panels (d–f) show mid-IR-to-THz conversion efficiency (in μW/W2) of the device at pump currents of 2.3 A, 2.8 A and 3.3 A, respectively, as a function of mid-IR pump frequencies ω1 and ω2. Black dashed lines in all panels correspond to the sets of data points with the constant values of THz DFG frequency at 2.8, 3.2, 3.6 and 4.0 THz. Points labelled with numbers indicate frequencies of the two mid-IR pumps for which we performed more detailed measurements of THz power output as a function of mid-IR pump powers as shown in Fig. 5. White dashed line in (f) indicates the set of data points used to determine Γ23 linewidth as shown in Fig. 6.

