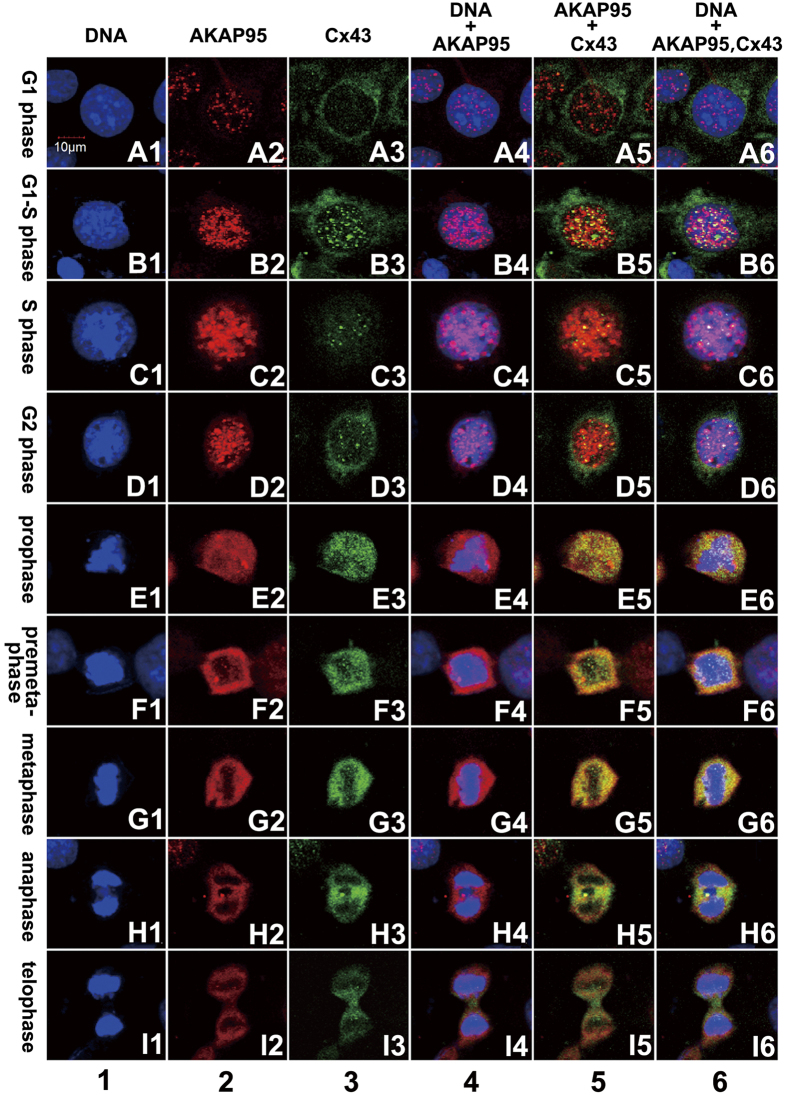
Figure 5. Expression, localization, and co-localization of AKAP95 and Cx43 in A549 cells during different cell cycle phases.
Column 1 (A1-I1): DAPI-labeled nuclei with morphological changes during a complete cell cycle from G1 to telophase; column 2 (A2-I2): expression and localization of TRITC-labeled AKAP95 in each cell cycle phase; column 3 (A3-I3): expression and localization of FITC-labeled Cx43 in each cell cycle phase; column 4 (A4-I4): merged images of columns 1 and 2; column 5: merged images of columns 2 and 3; and column 6: merged images of columns 1, 2, and 3 (200 × 3). The experiment was repeated four times.

