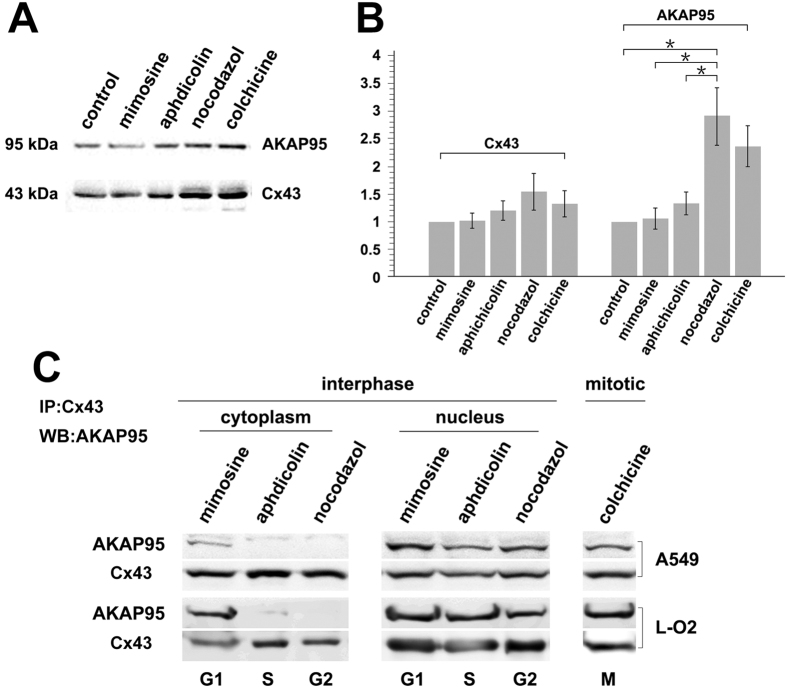
Figure 6. Interaction between Cx43 and AKAP95 in A549 and L-O2 cells at different cell cycle phases.
A549 and L-O2 cells were treated with L-mimosine (G1) (75 and 80 μg/mL), aphidicolin (S) (0.8 and 1 μg/mL), nocodazole (G2) (0.6 and 1 μg/mL), and colchicine (M) (0.5 and 0.5 μg/mL) for 24 h. A portion of the cells were subjected to total protein extraction and analysis. (A) Changes in AKAP95 and Cx43 expression determined by Western blot; and (B) statistical analysis of AKAP95 and Cx43 expression levels derived from images acquired by the BioRad Chemi DOC XRS + Imaging System. The gray value of protein bands was scanned using Image Lab5.0, and the ratio of band intensity in the treatment group versus the control group was determined using one-way analysis of variance in SPSS 21.0. * indicates statistically significant difference between groups at p < 0.05. Remaining cells were subjected to cell fractionation. (C) Co-immunoprecipitation assay using anti-Cx43 antibody and Western blot using anti-AKAP95 antibody, when cytoplasm and nuclear protein were separated, a small amount nuclear membarnce protein was ramained in the cytoplasm protein. The experiment was repeated four times.

