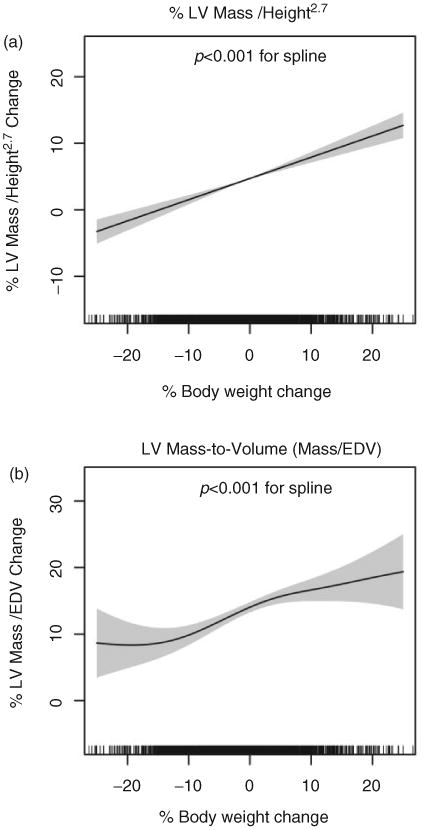
Figure 3.

Smoothing splines obtained from fit of MESA data to general additive models (GAM) for percent change in height-indexed LV mass (Figure 3a) and LV mass-to-volume ratio (Figure 3b), with initial body mass index, age, gender, race and systolic blood pressure at baseline included as predictors for simultaneous adjustment. Weight loss and gain appear linearly associated with changes in LV mass (Figure 3a). LV mass-to-volume ratio changes linearly with body weight between −10% and +10% weight change, with significant non-linearity outside this regime. The density of hash marks on the x-axis represents the distribution of weight loss in the population studied. Grey bands represent 95% CI for the spline and p values refer to significance of the smooth term (spline) in the GAM that represents body weight change.
