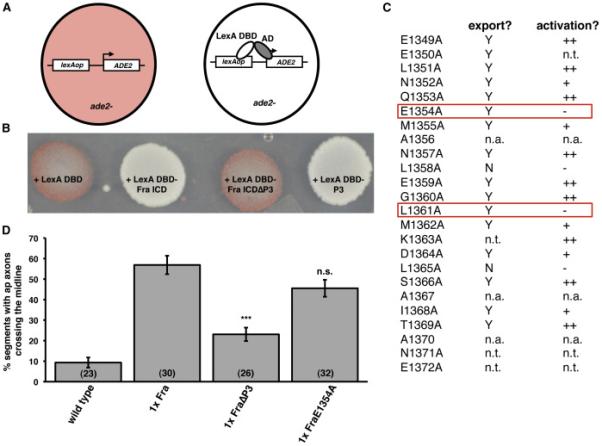
Figure 5. The Fra ICD encodes a transcriptional activation domain.

A) Schematic of yeast activation assay.
B) Yeast were transformed with plasmids encoding LexA DBD and the indicated forms of the Fra ICD. Note that P3 is necessary and sufficient for activation.
C) Summary of an alanine mutagenesis scan to identify point mutations within P3 that specifically disrupt transcriptional activation. Data in the export column indicate whether the mutant ICD was exported from the nucleus in S2R+ cells. Y indicates that the ICD did not accumulate in the nucleus in the absence of Leptomycin B. N indicates that the ICD accumulated in the nucleus in the absence of Leptomycin B. Data in the activation column indicate whether the mutant ICD functioned as transcriptional activator in the yeast assay. ++ indicates that the yeast appeared white; + indicates that the yeast appeared light pink; - indicates that the yeast appeared dark pink. n.t. indicates that the mutant was not tested. n.a. indicates alanine residues within P3. The mutants enclosed in the red boxes appear functional for nuclear export, but non-functional for transcriptional activation.
D) Quantification of ap axon crossing in stage 16-17 embryos. Data were analyzed by ANOVA, followed by Student's t-test. *** indicates p<0.0001, compared to embryos expressing Fra. n.s. indicates p>0.05, compared to embryos expressing Fra. Error bars indicate SEM. Number in parentheses indicates number of embryos scored. Note that the data for wild type embryos are also shown in Figure 3B.
See also Figure S2.
