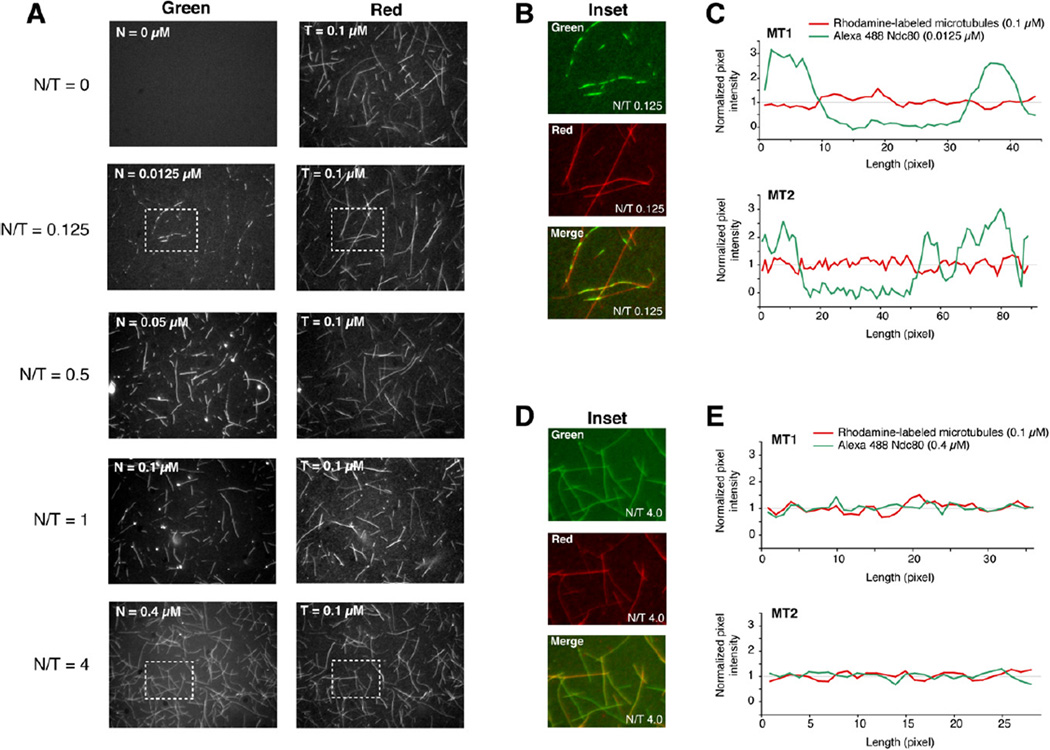
Figure 5. Visualization of Microtubule Binding.
(A) A mix of rhodamine-labeled tubulin:tubulin at a 0.16 ratio and final concentration of 100 nM was polymerized and incubated with increasing amounts of Alexa-Ndc80bonsai. N/T is the Ndc80bonsai/tubulin concentration ratio.
(B) Inset from N/T = 0.125 showing clusters of fluorescent Ndc80bonsai on microtubules.
(C) Line scans of two representative microtubules. The net fluorescence intensity (signal – background) at each pixel was divided by the mean net fluorescence intensity along the line scan.
(D) Inset from N/T = 4.0 showing even distribution of Ndc80bonsai.
(E) Line scans of two representative microtubule analyses as for (C).

