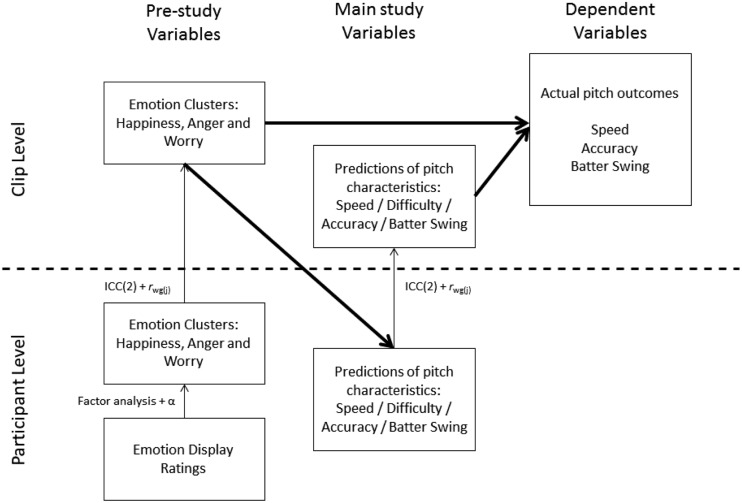
FIGURE 2.
Schematic representation of the multilevel nature of the data and the data analyses. Narrow arrows represent aggregation (the indicated analytical techniques were used as criteria before aggregation) and bold arrows represent IV to DV relations. Analyses within one data level (e.g., using only clip-level variables) were conducted using generalized linear models (GLMs), and analyses using variables from both levels were conducted using generalized mixed-effect models (GLMMs). The final mediation analysis is not indicated in this schematic overview for the sake of clarity.

