
Fig. 1.
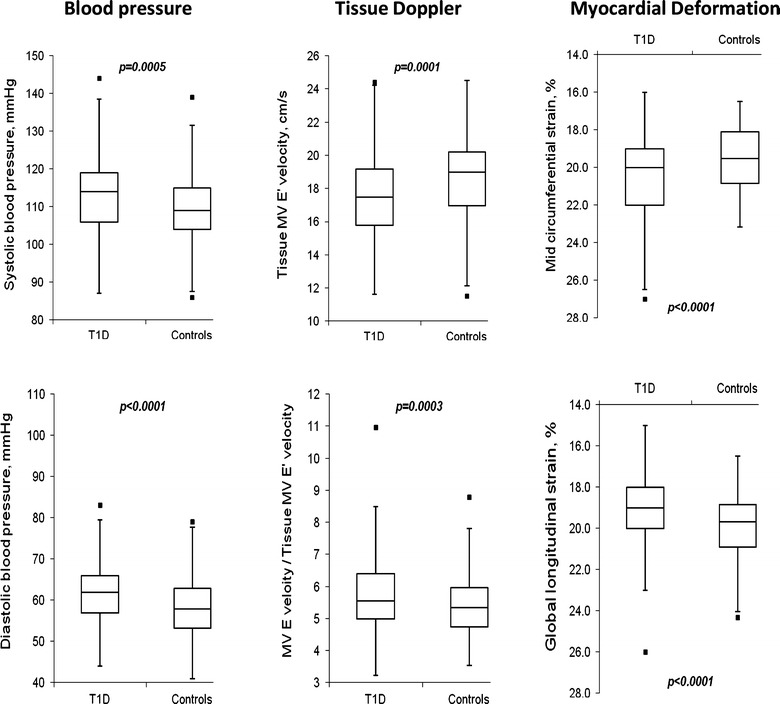
Box and whisker plots of significant group differences in blood pressure and echocardiographic measurements between adolescents with type 1 diabetes and controls. Boxes represent inter-quartile ranges (IQR), the ends of the whisker are set at 1.5* IQR above the third quartile and 1.5* IQR below the first quartile, and the minimum or maximum outliers are only shown if outside this range