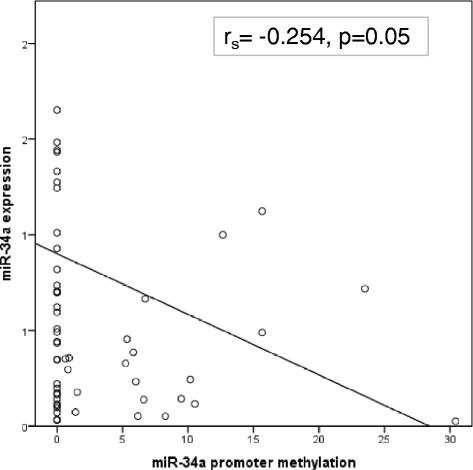
Fig. 2.

Correlation between miR-34a expression and miR-34a methylation. Graphic representation of the inverse linear correlation between miR-34a expression and its promoter methylation. Y-axis represent miR-34a expression as arbitrary units normalized to TBP and X-axis represent methylation of miR-34a as PMR value (percentage of methylated reference)
