Fig. 2.

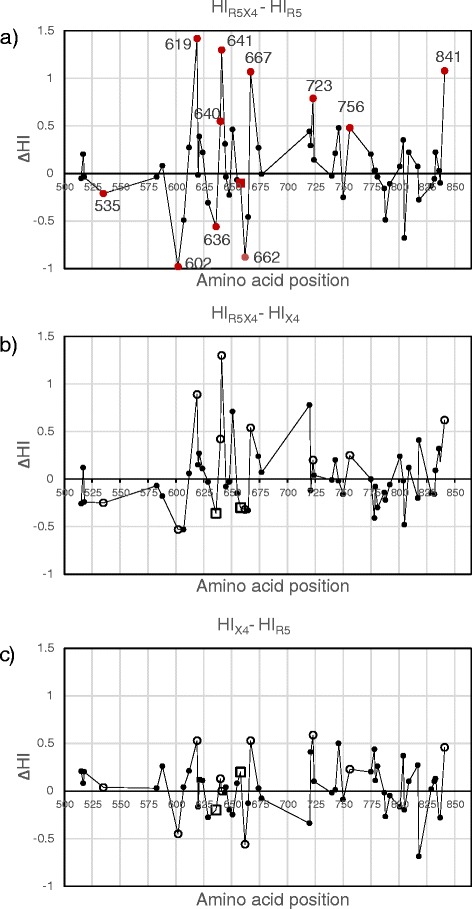
Mean hydropathy index differences (∆HI) of all 58 variable positions included in Additional file 1: Table S1. (a) ∆HI between R5X5 and R5 sequences. Positions showing significant differences of HI (QFD = 0.05) between R5X4 and R5 viruses are indicated with red circles. Position 658, which exhibited difference in charge only (Table 3) is indicated with a red square. Positions with the largest differences in amino acid frequencies between coreceptor groups (see Fig. 3) are indicated with position number. (b) ∆HI between R5X5 and X4 sequences. (c) ∆HI between X4 and R5 sequences. Positive or negative differences in HI imply a hydrophobic or hydrophilic tendency, respectively, for R5X4 (a, b) or X4 (c) sequences. Note that positions that were significant in the R5X4-R5 comparison (a) where not significant for the comparisons shown in (b) and (c), and are presented to illustrate the diminution of the hydrophobic or hydrophilic tendency of the respective residues (white circles and squares)
