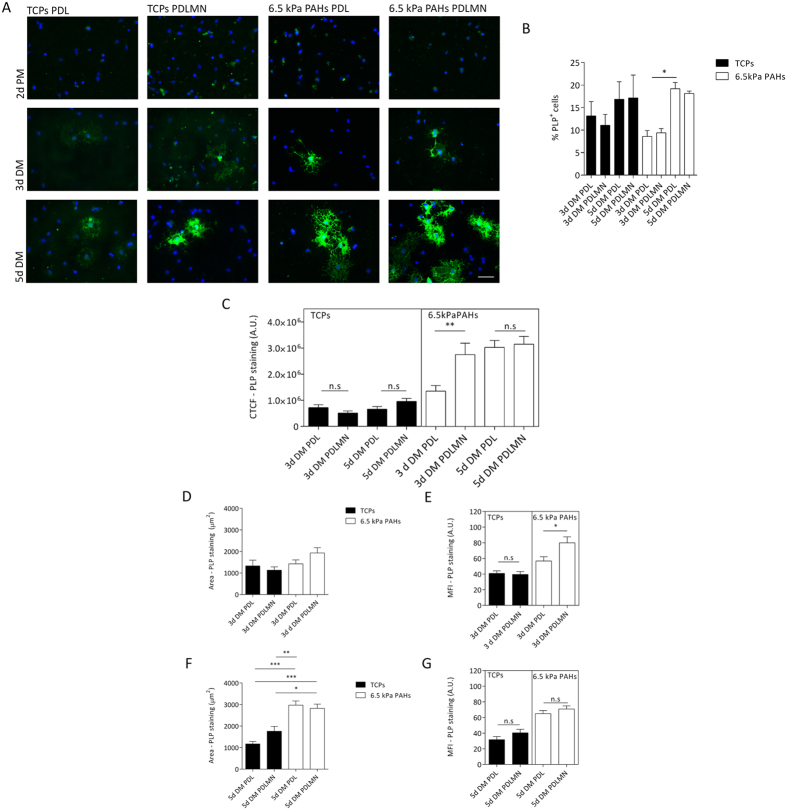
Figure 4. Maturation of primary rat OPCs using distinct substrates and conditions.
(A) Representative immunofluorescence microscopy images of primary rat oligodendrocytes stained for PLP (in green, and nuclei were counterstained with DAPI, in blue), cultured for 2 days in proliferation medium (2d PM), or for 3 or 5 days in differentiation medium (3d DM or 5d DM, respectively). Cells were maintained on TCPs or 6.5 kPa PAHs coated/functionalised with PDL or PDLMN, as indicated. Scale bars correspond to 50 μm. (B) The percentage of PLP-positive cells was quantified for each experimental condition (3 or 5 days in DM) and platform. Data represent the mean ± SEM of at least three independent experiments. Statistical analysis was performed by two-way ANOVA followed by Bonferroni post-test. (C) Quantification of CTCF for PLP signal of primary rat oligodendrocytes cultured with DM for 3 or 5 days on TCPs or 6.5 kPa PAHs coated/functionalised with PDL or PDLMN. Data represent mean ± SEM of at least 3 independent experiments. (D,F) Measurement of the PLP signal area of primary rat oligodendrocytes cultured with DM for 3 days (D) or 5 days (F) on TCPs or PAHs coated/functionalised with PDL or PDLMN. Data represent mean ± SEM of at least 3 independent experiments. Statistical analysis was performed by one-way ANOVA followed by Tukey’s multiple comparison test. (E,G) Mean fluorescence intensity (MFI) of PLP signal of oligodendrocytes cultured on TCPs or PAHs for 3 days (E) or for 5 days (G). Data represent mean ± SEM of CTCF of at least 3 independent experiments. Statistical analysis was performed by t-test. All statistical analysis was performed using the software GraphPad Prism 6 and the statistical significant differences were represented using the connectors (n.s.: non-significant, *p < 0.05, **p < 0.01, ***p < 0.001).

