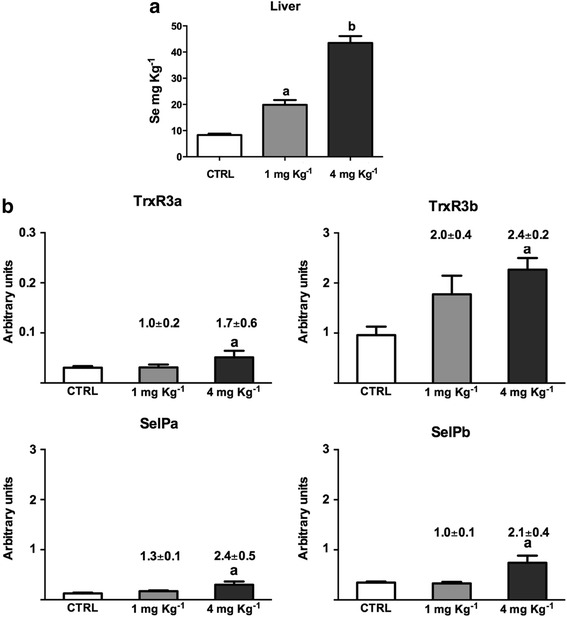
Fig. 1.

Se concentration in liver (a), and transcriptional modulation of selected selenoprotein genes in liver (b). Total Se concentration was determined in liver tissue using ICP-MS in reaction cell mode. The results represent the mean + SEM of 12 fish from three different tanks for each diet group. The expression of gene transcripts was quantified by qPCR and normalized against the geometric mean of three housekeeping genes (ef1α, drpII, hprt1), and then used for statistical analysis. The transcript expression is reported as arbitrary units and a fold change, calculated as the average expression level of fish fed the control diet divided by that of fish fed the experimental diets, is reported above the bars. The results represent the mean + SEM from 18 fish from three replicate tanks for each experimental group. The letters above the columns indicate statistically significant results versus the controls, as assessed by one-way ANOVA (p < 0.05), with different letters indicating significant differences between the treatments
