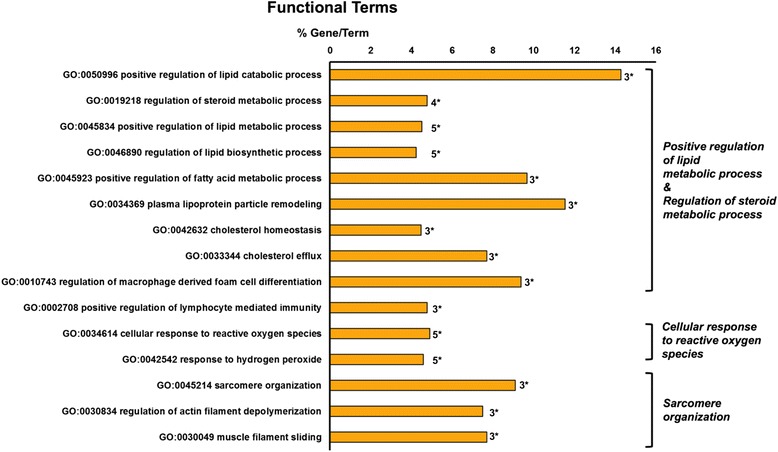
Fig. 5.

Functional terms enrichment of the identified transcripts in the liver of fish fed a diet enriched with 4 mg Se Kg−1. The bars represent the percentage of genes found compared to all the genes associated with the term, and the number of genes is displayed. The minimum number of genes assigned to each term was three. A two-sided hypergeometric method was applied as the statistical test and the p values were corrected with the Bonferoni step-down method. Only terms with a p < 0.05 are shown. A Kappa score equal to four was used as cut-off for GO term grouping. The level of significance for terms and groups is indicated with an asterisk: “*”p < 0.05
