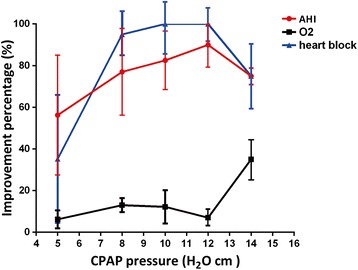
Fig. 2.

Percentages of improvement in the sleep and arrhythmia parameters at different levels of CPAP therapy pressure. The curve illustrates a dose-associated improvement in O2 desaturation, AHI and elimination of arrhythmia at different levels of CPAP therapy pressure (5, 8, 10, 12, and 14 cm H2O) in the setting of mild/severe sleep apnoea (AHI > 10). N = 5/group
