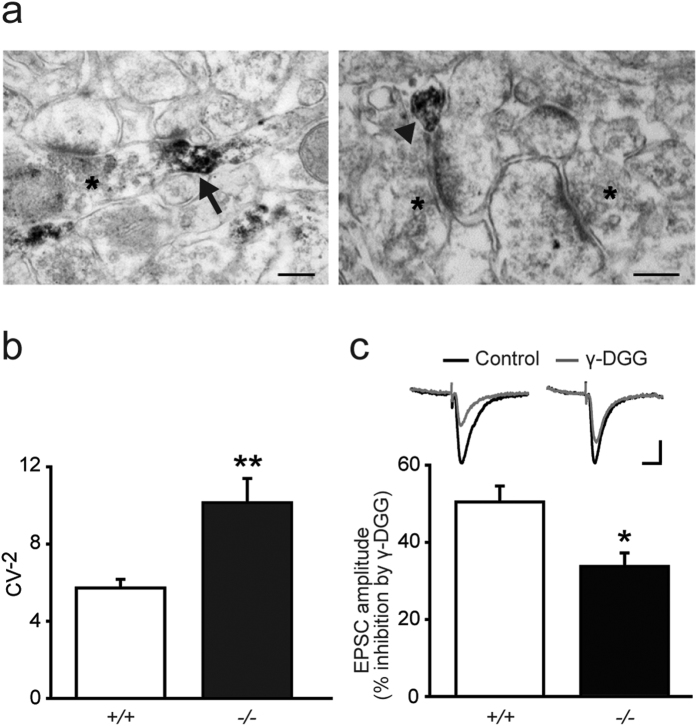
Figure 4. Presynaptic alterations lead to increased synaptic glutamate levels in Lgi1−/− mice.
(a) Hippocampal electron micrographs from an Lgi1+/+ mouse showing the subcellular localization of Lgi1, immunostained with patient CSF, in presynaptic elements (arrow) and thin neurites (arrowhead). Non-reactive synaptic contacts are labeled with asterisks. Scale bars: 200 nm. (b) Coefficient of variation (CV) analysis of AMPAR eEPSC amplitude reveals an increase in CV−2 in CA1 pyramidal cells from P8 Lgi1−/− (n = 23) compared to Lgi1+/+ mice (n = 22; p < 0.05, t-test). (c) Synaptic glutamate levels, revealed by γ-DGG (500 μM) inhibition of eEPSC amplitude, are enhanced in P8 Lgi1−/− (n = 6) compared to Lgi1+/+ mice (n = 7; p < 0.05, t-test).

