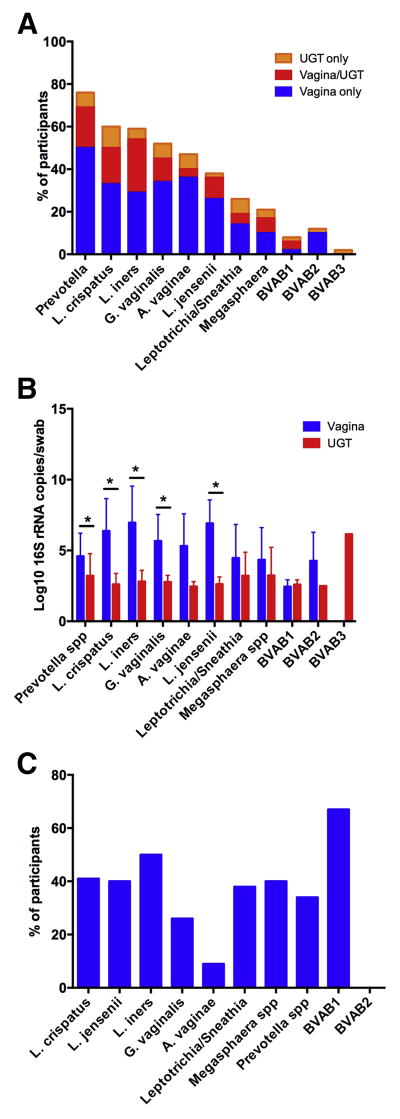
Figure 1. Distribution of upper genital tract bacterial colonization.
A. Proportion of participants with detection of bacteria by species-specific qPCR in the vagina alone, both vagina and upper genital tract (UGT) and UGT alone. B. Comparison of mean quantity of bacteria in the vagina and UGT of women with either vaginal or upper genital tract detection of that species. * denotes comparisons that are significantly different (p < 0.05) by t-test. C. Proportion of women with vaginal detection of a given species by qPCR who also had UGT detection of that species.

