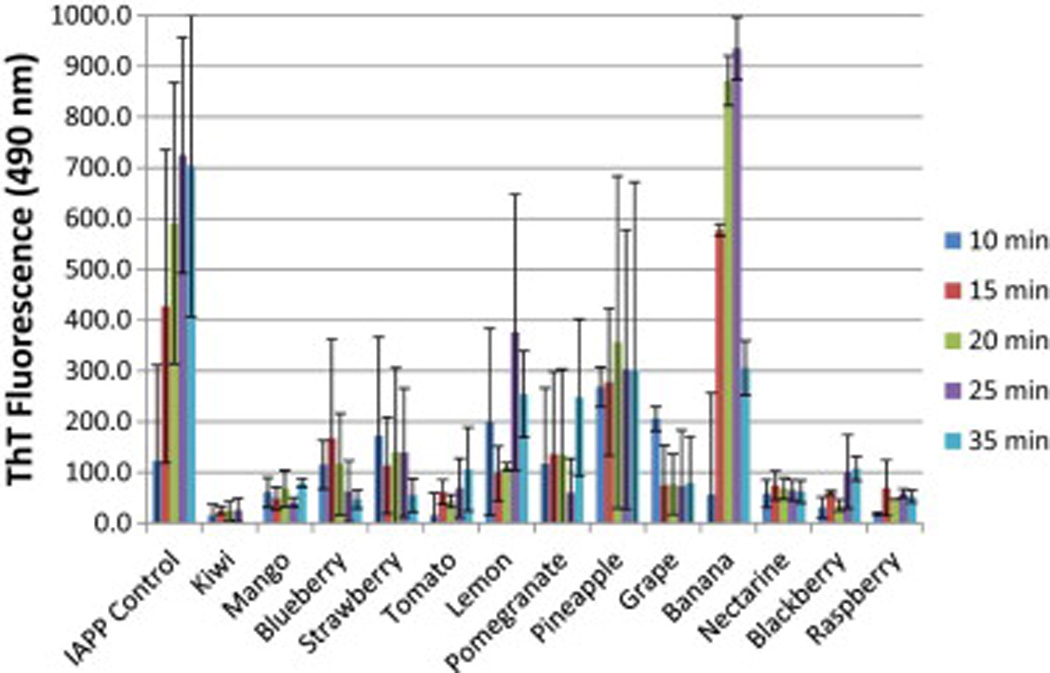
Figure 1.

Thioflavin T fluorescence of IAPP alone and IAPP in the presence of each fruit extract. Fluorescence was measured with an excitation wavelength of 450 nm and an emission wavelength of 488 nm. The solution concentration of IAPP was 106 µM for each sample. Data is the average of at least three data sets.
