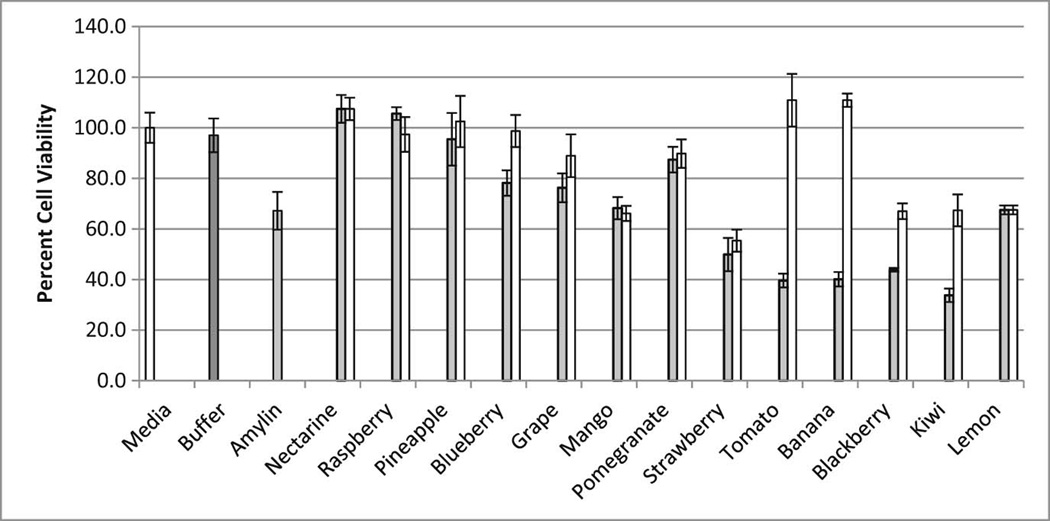
Figure 6.
Relative cell viability (%) in the presence of IAPP and/or fruit extracts. The “Media” and “Buffer” samples represent cell viability in the presence of media alone and media with Tris Buffer respectively (no IAPP was included in these samples). “Amylin” shows the effect of IAPP on cell viability. Grey bars indicate samples with IAPP and the specified fruit extract. White bars correspond to the effect of each individual fruit extract alone (with no IAPP present) on the viability of cells.

