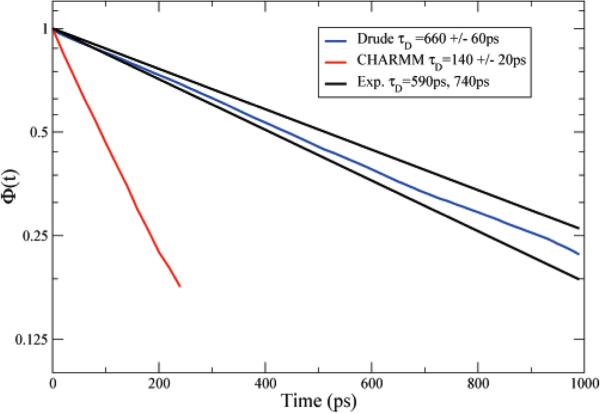
Figure 6.
The autocorrelation function of the system dipole, M(t), plotted on a semilog plot. The Debye relaxation time (τD) is extracted from a single-exponential fit. The simulations and experiment correspond to a temperature of T = 308 K. The experimental curves correspond to single exponentials with a time constant corresponding to the experimental Debye time. The Drude model corresponds to the optimal choice of LJ parameters from the unscaled/vthole class of electrostatic models.

