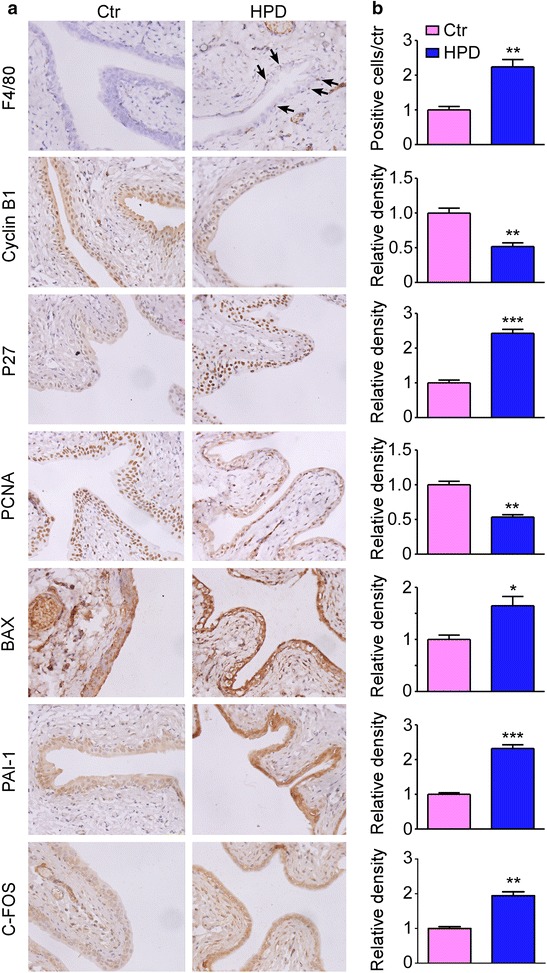
Fig. 8.

Immunohistochemistry of representative proteins in the over-represented biological processes. a Representative immunohistochemistry (left) of the bladder urothelium from the two groups. Arrows F4/80 positive cells. b Bar graphs showing the positive cells or density ratios of the representative proteins to control group. 5 sections per mouse from 6 mice were quantitated and averaged by Image Pro Plus 6.0 software. Mean ± SEM., *P < 0.05, **P < 0.01 and ***P < 0.001
