
Fig. 4.
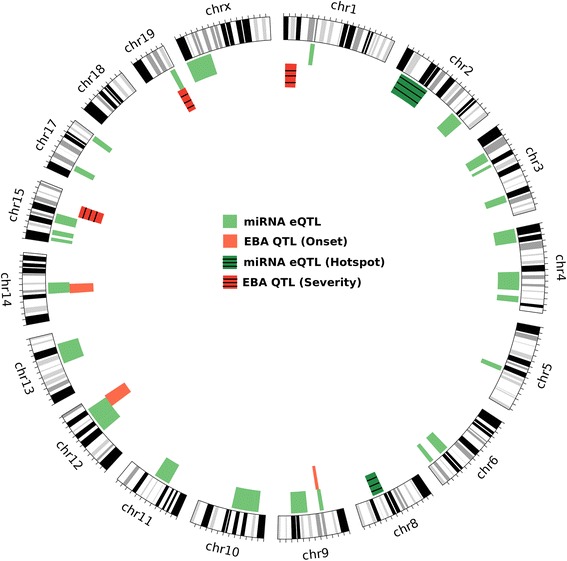
Overlapping QTL for EBA disease and miRNA eQTL. The circular plot shows all the eQTL for miRNAs (green) and QTL for EBA (red). It also presents the eQTL hot spots (dark green) and EBA QTL for onset (red) and severity (dark red). Each circular band represents a chromosome on which QTL and eQTL are mapped. The region within the chromosome which has either red or dark red and green or dark green bands is overlapping eQTL with EBA QTL