
Fig. 6.
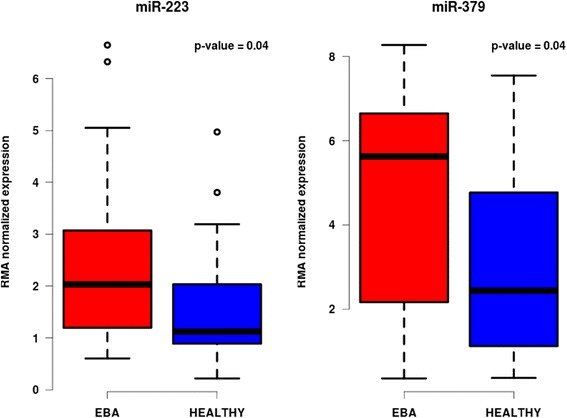
Boxplot showing differentially expressed miRNAs. The box plot shows the most differentially expressed miRNAs miR-223 and miR-379 for the disease phenotype EBA. The plots in blue color show the expression of miRNAs in mice with no clinical phenotype while mice with signs of inflammation are shown in red