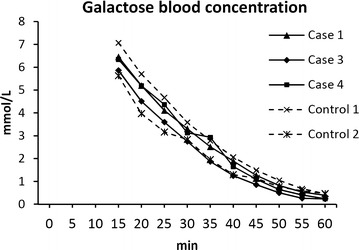
Fig. 4.

The time/arterial blood galactose concentration curve during GEC testing at 44 h PI. Slopes are identical for all pigs in the saturated, linear phase, suggesting identical galactose elimination capacities before correction for urinary output. The finding was confirmed by calculation of actual GEC rates
