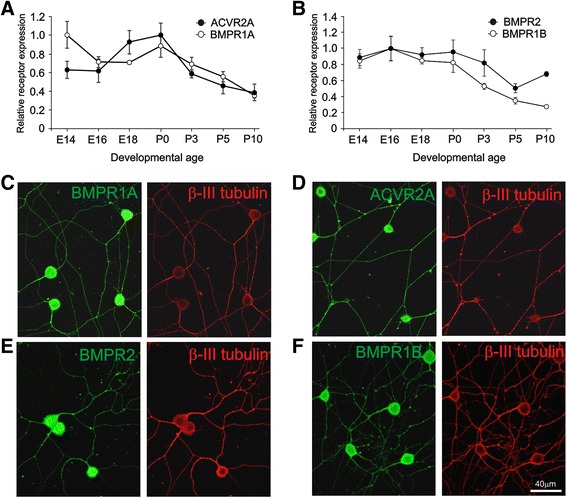
Fig. 3.

Expression of GDF5 receptors. a, b Expression of transcripts encoding GDF5 receptors in the SCG at stages from E14 to P10 relative to the geometric mean of Gapdh, Sdha and Hprt1 reference mRNAs (mean ± SEM, n = 3 per age). a Relative levels of Bmpr1a and Acvr2a mRNAs normalised to the peak of expression at E14 and P0, respectively. b Relative levels of Bmpr1b and Bmpr2 mRNAs normalised to the peak of expression at E16. c to f Photomicrographs of representative P0 SCG neurons cultured for 24 h with NGF and double labelled for β-III tubulin and either BMPR1A (c), ACVR2A (d), BMPR2 (e) or BMPR1B (f). Scale bar = 40 μm
