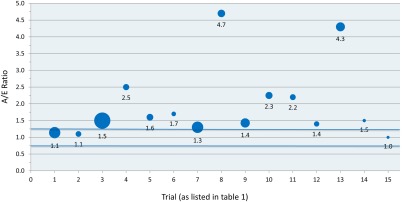
Figure 2.

Actual‐over‐expected ratios (A/E) for trials with overall survival as a primary endpoint are shown. The size of the bubble is proportional to the sample size of the control cohort. Blue lines delineate the region between 0.75 and 1.25, termed as being an accurate estimation.
