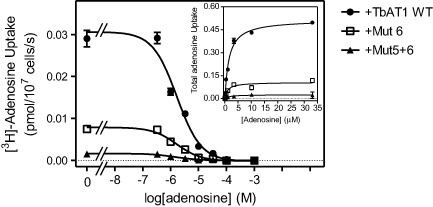
Figure 3.

Transport of 0.1 μM [3 H]‐adenosine by B48 cells expressing various TbAT1 alleles as indicated (numbering as in Fig. 1), in the presence or absence of various concentrations of unlabelled adenosine. Main figure: experiment performed in triplicate with unlabelled adenosine as inhibitor, resulting in sigmoid competition curves. Inset: conversion of the same experiment to Michaelis‐Menten saturation plots displaying total adenosine uptake against adenosine concentration. The experiment depicted is representative of four independent experiments, which are summarised in Table 1.
