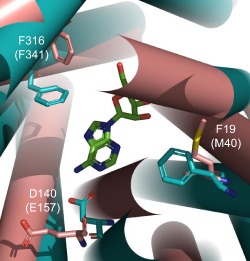
Figure 5.

Structural overlay between the LdNT1.1 model published by Valdes et al. (2009; 2012) – in brown; and the TbAT1 model obtained created by ROBETTA – in cyan. The extracellular side is shown. The ligand adenosine docked in the TbAT1 protein model is shown in green carbon atoms. Helices are indicated by rigid cylinders. The extracellular and intracellular TM‐helical loops were not modelled and are therefore not shown. The TbAT1 residue numbering is used, with the LdNT1.1 residues in brackets. The image was created using PyMol version 1.50.04, Schrödinger.
