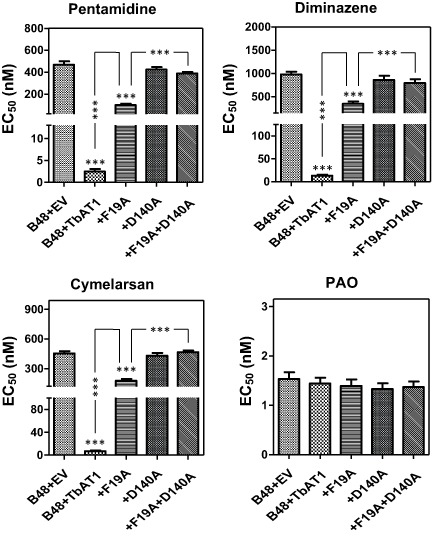
Figure 8.

EC50 values obtained by the Alamar Blue test for strains expressing mutant alleles of TbAT1. Bars represent the average and SEM of six independent experiments. Statistical significance was determined by a one‐way ANOVA, compared to B48 + EV except where specifically indicated.
