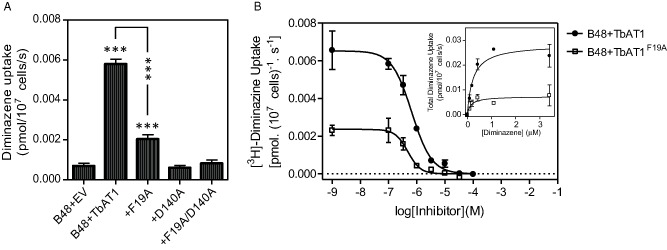
Figure 9.

Uptake of 0.1 μM [3 H]‐diminazene is significantly reduced following reintroduction of mutated TbAT1 relative to the wild type TbAT1.
A. Transport of diminazene was assessed in each strain. Bars show mean rate of transport ± SEM at 1 min when normalised for background, n = 4. * = P < 0.05, ** = P < 0.01, *** = P < 0.001 (one‐way ANOVA and Dunnett's test), compared against B48 + EV, unless otherwise indicated.
B. Inhibition (main figure) and saturation plot (inset) of 0.1 μM [3 H]‐diminazene over 60 s in the presence or absence of various concentrations of unlabelled diminazene as indicated. The experiment show was performed in triplicate and representative of four independent experiments, which are summarised in Table 2.
