
Figure 1.
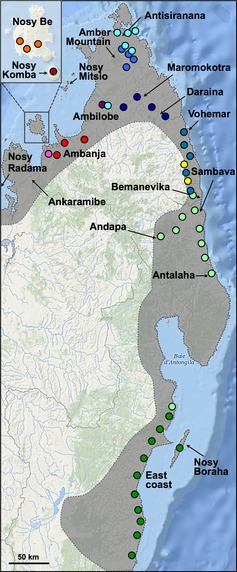
Sampling panther chameleons in Madagascar. Sampling locations are indicated with colours corresponding to mitochondrial haplogroups shown in Fig. 2. The location of a single individual from haplogroup 10 (light green) found on the east coast probably represents the southern limits of this haplogroup distribution. The most western locations of Nosy Radama and Ankaramibe were not sampled; instead, analysis was performed on captive individuals (haplotype L1 in Fig. 2). The shaded area represents the species entire distribution range.