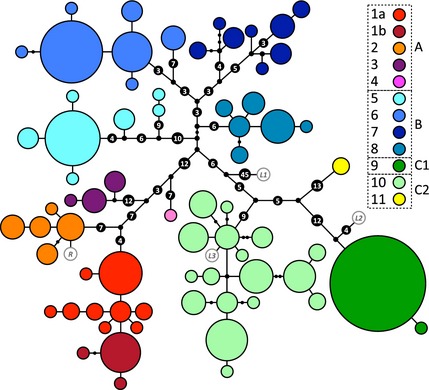
Figure 2.

Panther chameleon mtDNA genealogical UMP (Cassens et al. 2005) network. Haplotypes are represented with coloured circles, the sizes of which are proportional to the number of individuals (smallest = 1, largest = 72). Inferred missing haplotypes are shown as small black dots, and each line indicates a mutational change (numbers of mutations >1 are shown inside larger black dots). Haplotypes are grouped into colour‐coded haplogroups; sub‐haplogroups 1a and 1b correspond to samples from the northwest coast and the island Nosy Komba, respectively. Haplotypes in white with grey border circles correspond to animals from Reunion (R) and the pet market (L1–L3).
