
Figure 6.
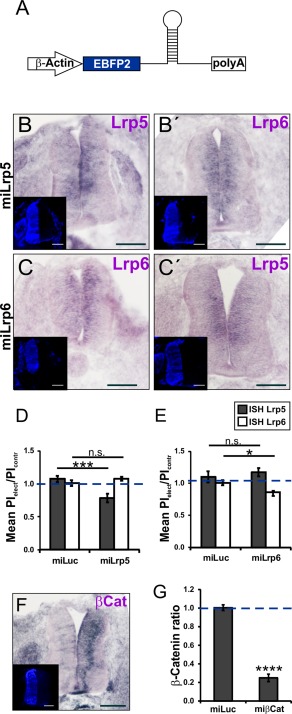
miRNAs efficiently and specifically silence the targeted gene. (A) Schematic drawing of the injected miRNA‐construct under the control of the β‐Actin promoter. The plasmid encodes EBFP2 to control for transfection efficiency. In the absence of specific antibodies, specificity and efficiency of Lrp downregulation could only be demonstrated by in situ hybridization, which is not a very suitable method for quantification. The values for gene silencing may not seem to be very high, but keep in mind that on average 60% of the cells in the targeted area are transfected. Thus, the theoretical maximum of target gene silencing is 60%, not 100%. Electroporation of a miRNA against Lrp5 (miLrp5) reduced expression of Lrp5 on the electroporated side (B) but did not affect Lrp6 expression (B'). Similarly, electroporation of a miRNA targeting Lrp6 efficiently reduced Lrp6 levels (C) without affecting Lrp5 (C'). Inserts show EBFP2 expression on the electroporated side. The ratio of the pixel intensities (PI) on the electroporated (elect) and the nonelectroporated (contr) side was calculated and compared to the value obtained for embryos injected with a miRNA directed against Luciferase (miLuc). Injection of miLrp5 (D) reduced Lrp5 levels by 22% (0.78 ± 0.07; 4 embryos, 18 sections; miLuc control 1.07 ± 0.05; 7 embryos, 34 sections) without affecting Lrp6 expression (1.08 ± 0.03; 4 embryos, 18 sections; miLuc control 1.01 ± 0.04; 4 embryos, 19 sections). Electroporation of miLrp6 (E) reduced Lrp6 levels (0.86 ± 0.05; 4 embryos, 20 sections; miLuc control 1.01 ± 0.04; 4 embryos, 20 sections), without changing Lrp5 expression (1.17 ± 0.07; 2 embryos, 12 sections; miLuc control 1.1 ± 0.09; 2 embryos, 13 sections). Electroporation of a miRNA against β‐Catenin (miβCat; F) significantly reduced the expression of β‐Catenin on the electroporated side (G; 0.25 ± 0.04; 6 embryos, 30 sections; miLuc control 1.00 ± 0.03; 5 embryos, 22 sections). t‐test for quantifications in D, E, and G. Scale bar 100 µm. [Color figure can be viewed in the online issue, which is available at wileyonlinelibrary.com.]