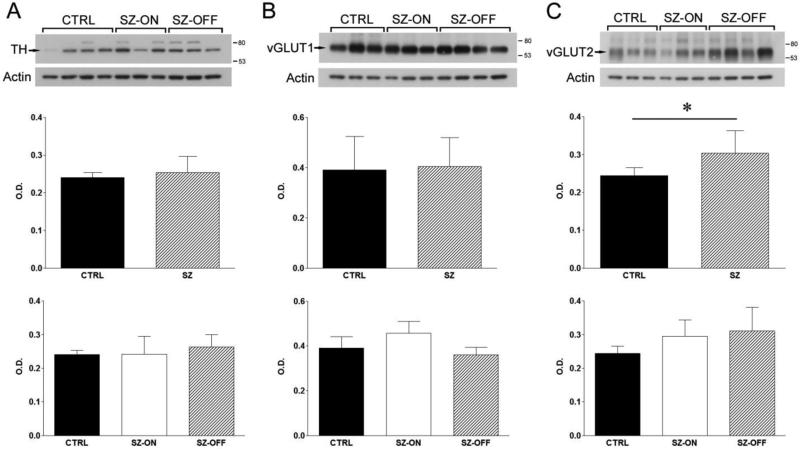
Figure 1.
Western blot analysis of TH, vGLUT1, and vGLUT2. Experiments were done in control (CTRL), schizophrenia on-drug (SZ-ON), and schizophrenia off-drug (SZ-OFF) subjects. Western blots were quantified by measuring calibrated optical density (relative units) of each band. Arrows point to the primary band at the expected molecular weight of each respective protein that was analyzed. Standards of 80 and 53 kDa markers are indicated on the right. Actin was a loading control. (A) Representative blots of TH for each group. Middle panel, TH protein levels of CTRL and all SZ cases. Lower panel, TH protein levels of CTRL, SZ-ON, and SZ-OFF groups. (B) Representative blots of vGLUT1 for each group. Middle panel, vGLUT1 protein levels of CTRL and all SZ cases. Lower panel, vGLUT1 protein levels of CTRL, SZ-ON, and SZ-OFF groups. (C) Representative blots of vGLUT2 for each group. Middle panel, vGLUT2 protein levels of CTRL and all SZ cases. Lower panel, vGLUT2 protein levels of CTRL, SZ-ON, and SZ-OFF groups. Bars represent standard deviation. *p < 0.05.

