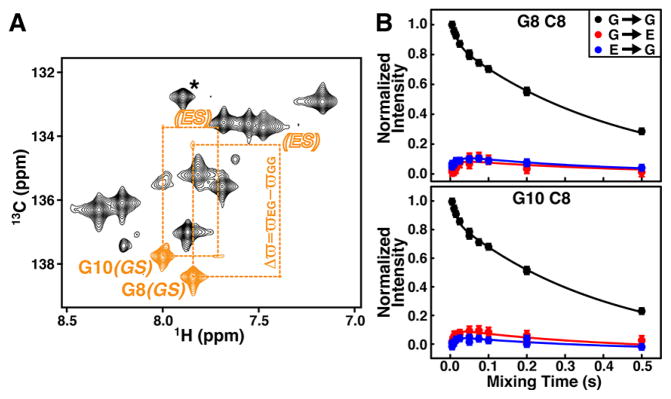
Figure 4.
Characterizing slow exchange in the ligand-free fluoride riboswitch by ZZ-exchange. (A) 1H-13C spectrum of base C8s from ZZ-exchange at 75 ms mixing time. Colored in orange are diagonal peaks from GS and cross-peaks between GS and ES of G8 and G10. “Invisible” ES diagonal peaks are labeled as open letters. Asterisk is aliased G30 peak. (B) Mixing time dependence of diagonal and cross-peak intensities for G8 and G10 from ZZ-exchange. Solid lines represent the best fits to a two-state exchange process.

