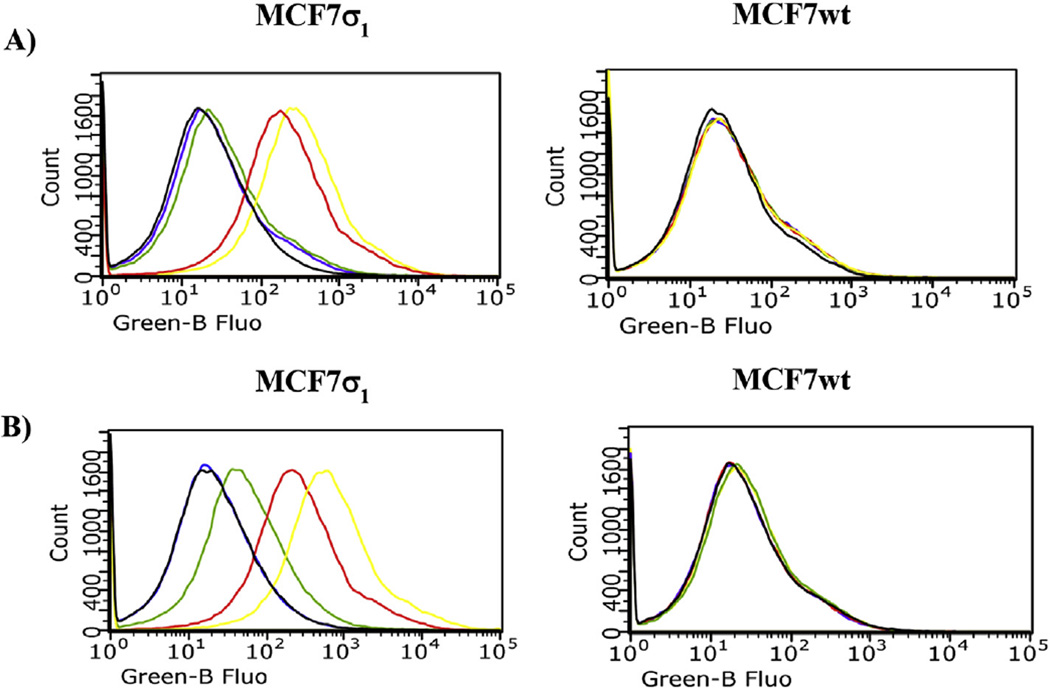
Fig. 3.
Flow Cytometry analysis (cell associated fluorescence vs cell count) of MCF7σ1 and MCF7wt, exposed to compound 5 or 6 and treated with compound 10 (10 µM) to mask σ2 receptors, or (+)-pentazocine (10 µM) to mask σ1 receptors, or both 10 (10 µM) with (+)-pentazocine (10 µM). A) Displacement of 5 (100 nM, yellow curve): black curve: control; red curve: 10 µM 10; green curve: 10 µM (+)-pentazocine; violet curve: 10 µM 10 with (+)-pentazocine 10 µM. B) Displacement of 6 (100 nM, yellow curve): black curve: control; red curve: 10 µM 10; green curve: 10 µM (+)-pentazocine; violet curve: 10 µM 10 with (+)-pentazocine 10 µM.

