
Figure 1. Liver-specific insulin receptor knockout (LIRKO) and IR/FoxO1 double knockout (LIRFKO) mice.
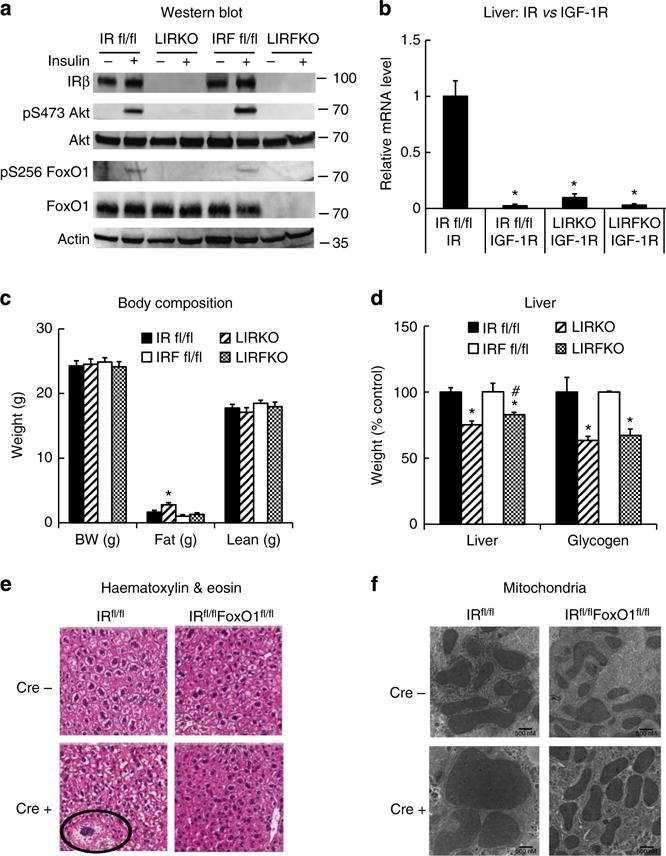
(a) Western blot. IR floxed (IR fl/fl), LIRKO, IR/FoxO1 floxed (IRF fl/fl) and LIRFKO mice were fasted for 4 h, then treated with insulin (10 U kg−1 i.p.) and killed 10 min later. Liver lysates were analysed by western blotting with specific antibodies against the insulin receptor β subunit (IRβ), serine 473-phosphorylated Akt, total Akt, serine 256-phosphorylated FoxO1, total FoxO1 or actin, as shown. Molecular weight markers are shown for each protein. (b) Insulin receptor (IR) and insulin-like growth factor-1 receptor (IGF-1R) expression in liver. IR and IGF-1R expression was measured by quantitative PCR in liver from freely fed IR fl/fl (N = 5), LIRKO (N = 4) and LIRFKO (N = 4) mice and expressed relative to IR mRNA levels in IR fl/fl mice. (c) Body weight and body composition. Body weight and body fat and lean mass (by NMR) are shown for 8-week-old male freely feeding IR floxed (solid bar, N = 10), LIRKO (hatched bar, N = 5), IR/FoxO1 floxed (open bar, N = 13) and LIRFKO (cross-hatched bar, N = 9) mice. (d) Liver weight and glycogen content. Liver weight and glycogen content were measured in tissues collected 6 h after refeding in IR floxed (N = 12), LIRKO (N = 10), IR/FoxO1 floxed (N = 7) and LIRFKO (N = 8) mice. Left. Liver weight adjusted for total body weight is expressed relative to floxed littermate controls. Right. Liver glycogen per mg protein is expressed relative to floxed littermate controls. (e) Haematoxylin and eosin stain. Liver was fixed in paraformaldehyde and embedded in paraffin prior to sectioning and staining, and slides were visualized by scanning at × 200 (Aperio Scanscope CS). Cellular atypia present in LIRKO liver is noted (circle). (f) Electron microscopy. Tissues were fixed with glutaraldehyde–paraformaldehyde and prepared for electron microscopy as described in Methods. The solid line in the lower right hand corner measures 500 nM. Results in Fig. 1b–d are presented as the mean and s.e.m. Statistical significance (*P < 0.05 versus IR floxed mice and #P < 0.05, LIRFKO versus LIRKO mice) was determined by one-way analysis of variance and Fisher’s post-hoc test.