
Figure 3. 13C-glucose tolerance and gene regulation.
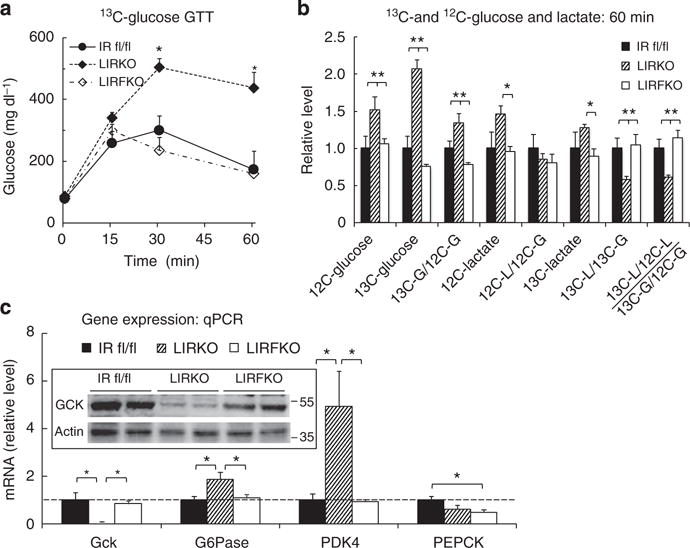
(a) Glucose levels. IR floxed (solid circles, solid line, N = 9), LIRKO (solid diamond, dot-dashed line, N = 13) and LIRFKO mice (open diamond, dashed line, N = 10) were fasted for 18 h overnight, and then treated with 13C-glucose (2 g kg−1 i.p.). Blood glucose levels were measured at the indicated time points, and mice were killed at 60 min for analysis of glucose and lactate isotopomer levels and hepatic gene expression. (b) 13C- and 12C-glucose and lactate levels. Plasma 12C- and 13C-glucose and lactate levels were measured in IR floxed (N = 4), LIRKO (N = 6) and LIRFKO (N = 4). Results for levels and calculated ratios were expressed relative to IR floxed mice. (c) Gene expression: quantitative PCR. Glucokinase (Gck), glucose-6 phosphatase (G6Pase), pyruvate dehydrogenase kinase 4 (PDK4) and phosphoenolpyruvate carboxykinase (PEPCK) mRNA levels were measured in liver collected 60 min post glucose by quantitative PCR and expressed relative to IR floxed mice (N = 8, 8 and 8 for IR floxed, LIRKO and LIRFKO mice, respectively). *P<0.05 by one-way analysis of variance and Fisher’s post-hoc test.