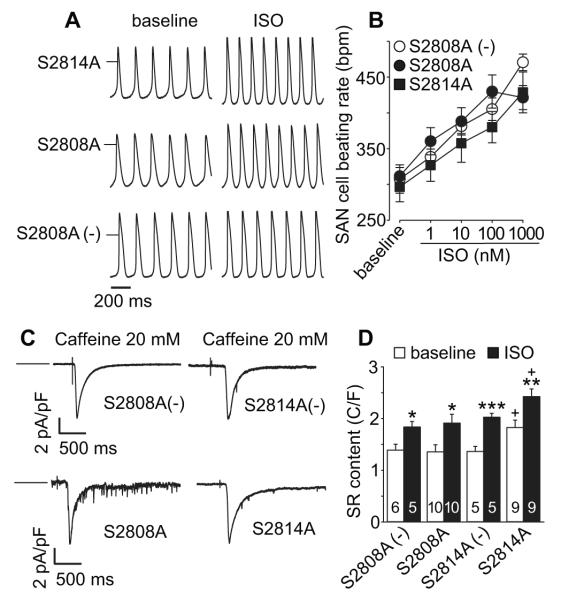
Figure 2.
SAN cell baseline beating rate and response to ISO were not altered in RyR2 mutant mice. A. Representative action potential recording traces (at baseline and after ISO application) from SAN cells isolated from S2814A (upper), S2808A (middle) and S2808A (−) littermate control (lower) mice. The short horizontal bars mark 0 mV. B. Summary data of SAN cell beating rates at baseline and response to increasing ISO concentration. n=6-14 cells/data point. C. Representative INCX current traces induced by caffeine triggered (20 mM) SR Ca2+ release (indicated by perfusion mark) in SAN cells isolated from the mice as indicated. The horizontal bars indicate 0 current level. D. SR Ca2+ content was increased in SAN cells isolated from the RYR mutation mice compared to SAN cells from littermate WT mice (C/F: Coulombs/Farad). Numbers of experimental SAN cells is indicated by numerals. *p <0.05, ** p<0.01 *** p<0.001 baseline vs ISO, unpaired Student’s t-test. + p<0.05, S2814A vs the other groups, One way ANOVA combined with Holm-Sidak test.

